5分钟就够了!小果带你用sf包绘制发表级地图

公众号后台回复“111”
领取本篇代码、基因集或示例数据等文件
文件编号:240122

#软件安装与调用install.packages(c( "ggplot2", "ggspatial", "sf", "rnaturalearth", "rnaturalearthdata"))library(ggplot2)library(sf)library(rnaturalearth)library(rnaturalearthdata)library(ggspatial)#获得世界地图的数据world <- ne_countries(scale = 'medium', #地图返回的比例尺,共有110, 50, 10 or 'small', 'medium', 'large'#上述返回值也影响着地图所获得的信息的多与少returnclass = "sf" #返回结果的格式。一般选择'sf')


class(world)
#简单绘制P1 <- ggplot(world) +geom_sf()P1

world$name
Thailand <- ne_countries(scale = 'medium',returnclass = "sf",country = 'Thailand' #此时对应world$name中的返回名)#创建图形P2 <- ggplot(Thailand) +geom_sf()P2

#改变颜色P3 <- ggplot(data = world) +geom_sf(color = "black", fill = "darkred")P3

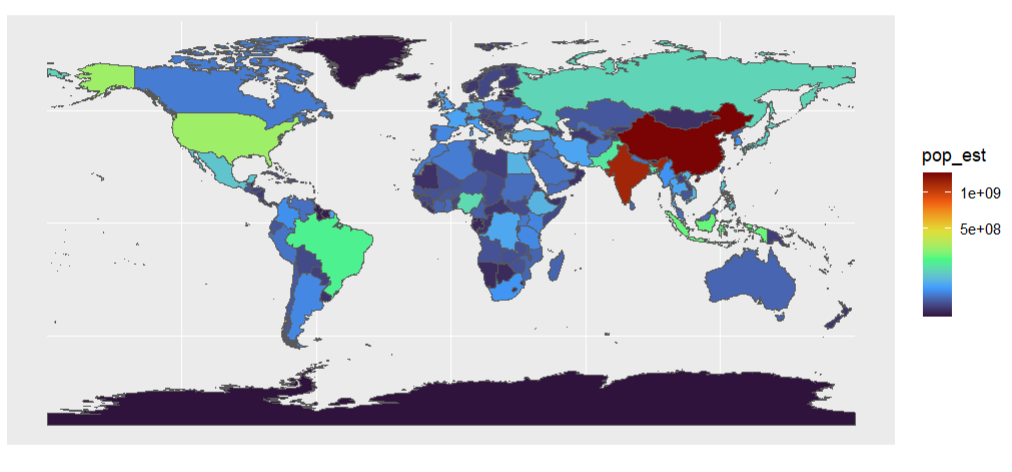
#改变渐变夜色P4 <- ggplot(world) + geom_sf(aes(fill = pop_est)) + #pop_est是人口#这个调色板属于viridis包中,还有magma,inferno,plasma,viridis,cividis,rocket,mako scale_fill_viridis_c(option = "turbo", #根据数值的平方根进行透明度调整,还有根据’log‘对数进行调整,或者默认不调整‘identity’ trans = "sqrt") P4
#对心仪位置进行绘画P5 <- ggplot(data = world) +geom_sf() +coord_sf(xlim = c(60, 140), ylim = c(0, 60), #经纬度expand = FALSE) #是否不用系统进行微调P5

#添加标签P6 <- ggplot(world) +geom_sf()+coord_sf(xlim = c(60, 140), ylim = c(0, 60),expand = FALSE) +#对标签进行绘制annotation_scale(width_hint = 0.2,location = 'bl') +#对指向进行绘制annotation_north_arrow(location = "bl", #位置,左上、右上、右下、左下which_north = "true", #是否指向北方pad_x = unit(0.25, "in"), pad_y = unit(0.5, "in"), #指北针与边框的距离style = north_arrow_fancy_orienteering)P6


定制生信分析
服务器租赁
扫码咨询小果


往期回顾
|
01 |
|
02 |
|
03 |
|
04 |